
CPC inflation: How fast are Google Ads costs rising?

Most advertisers will confidently tell you that the cost per click (CPC) on Google Ads rises year after year. But is that actually true?
And if it is, how quickly are CPCs inflating?
Surprisingly, there’s no simple answer.
To get closer to the truth, we’ll explore three reliable data sources – and explain why this question matters more than most advertisers realize.
The problem of CPC inflation
If you advertise on Google, CPC inflation should be high on your list of concerns. Why?
Because rising CPCs directly erode advertising performance.
For example, if CPCs increase by 5% this year, your budget will deliver 5% fewer clicks – assuming all other variables stay constant.
Let’s look at a simple example to illustrate:
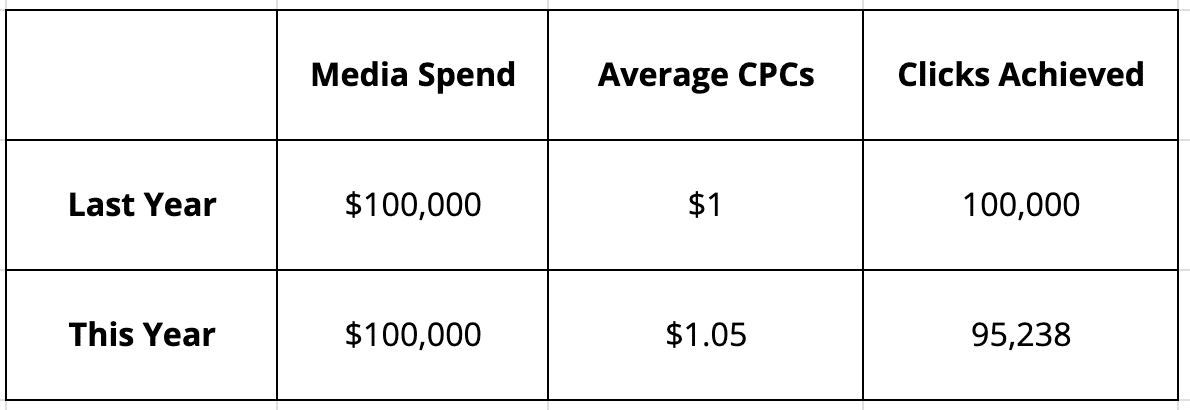
If average CPCs rise by 5%, advertisers lose 5% of their clicks – despite spending the same amount.
But performance targets don’t go down just because costs go up.
In most cases, the only way to keep up is to increase total ad spend by that same 5%.
That might work – if you can also raise your prices by 5%.
The example below shows how adjusting pricing can maintain revenue outcomes, even as CPCs increase.
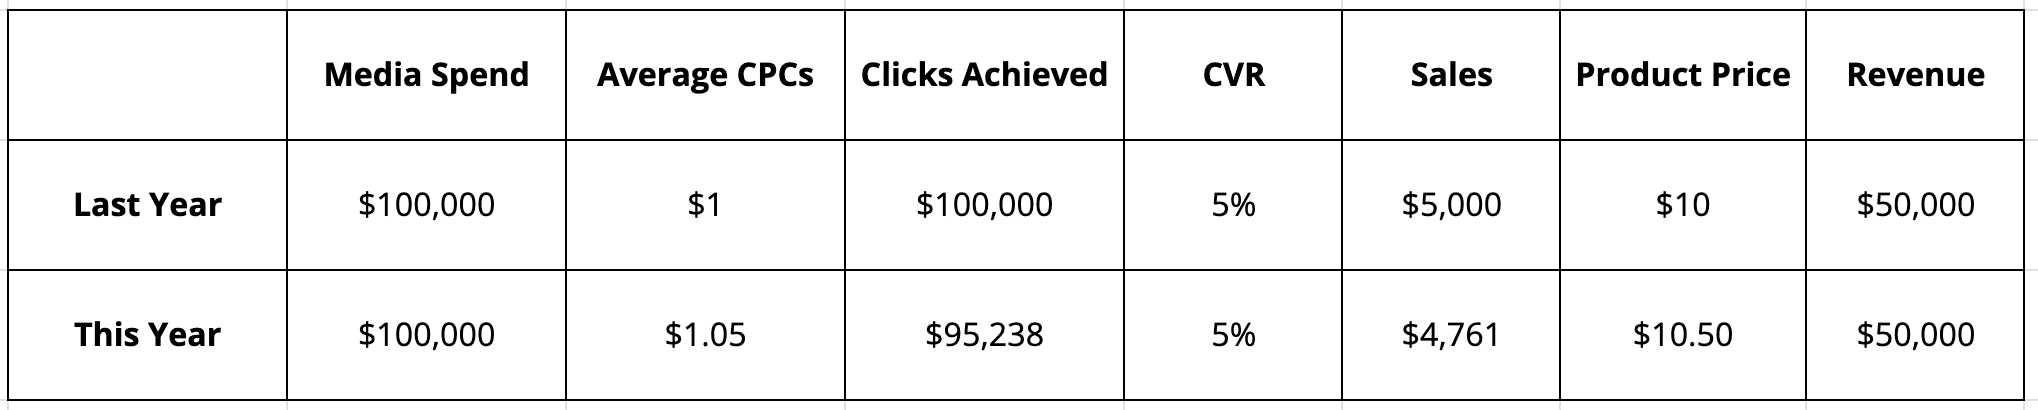
And this is where the problem lies: as CPCs continue to rise, businesses are forced to increase their prices just to stay level.
Ideally, prices rise at the same rate as market inflation.
But if CPCs rise faster than inflation, your margins start to erode.
That’s the danger of CPC inflation – and it often goes unnoticed.
So, how big is this problem really?
To answer that, we’ll look at three key data sources that reflect CPC trends over time:
- Google annual reports: Alphabet, as a public company, reports changes in CPCs as part of its revenue breakdown.
- Third-party tools (WordStream): WordStream collects data from thousands of Google Ads campaigns and publishes annual CPC benchmarks by industry.
- Owned ad accounts: At our agency, we track exact search terms over several years across multiple industries to measure CPC fluctuations at the most granular level.
CPCs from Alphabet’s annual reports
To better understand CPC trends, we extracted data from Alphabet’s annual reports (Form 10-K) covering the years 2018 to 2024.
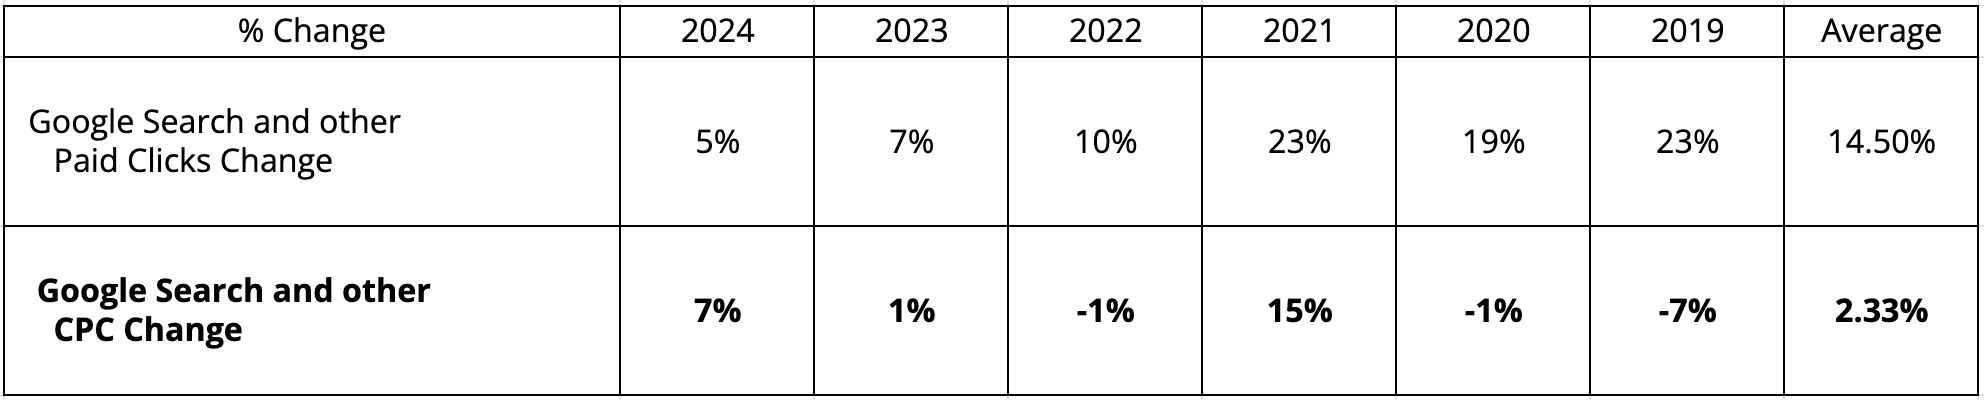
This table shows the year-over-year percentage change in two key metrics:
- The volume of paid clicks.
- Average CPCs.
For example, the 2024 column represents the change compared to 2023.
The “Average” column has been added for reference and does not appear in the original reports.
What stands out is that in three of the six years (2024, 2023, and 2021), both paid clicks and CPCs increased.
In those years, Google effectively earned more by generating more clicks and charging more per click.
The most dramatic shifts occurred between 2020 and 2021, a period marked by COVID-driven growth in online activity.
As demand surged, competition rose – and so did CPCs.
Looking at the broader trend, the volume of paid clicks increased every year, averaging a 14.5% annual growth rate.
But CPCs only rose in three out of the six years, with an average annual increase of just 2.33%.
This is surprisingly low – I expected a more consistent upward trend of at least 3% per year.
However, there are important limitations to this data.
Alphabet’s reports likely cover more than just Google Search – other platforms like YouTube and the Display Network may be included.
Additionally, the figures reflect global data, which could be skewed downward by lower CPCs in emerging markets.
It’s also possible that the growing use of automated bidding tools has contributed to slower CPC inflation overall.
Dig deeper: Dealing with Google Ads frustrations – Poor support, suspensions, rising costs
Get the newsletter search marketers rely on.
See terms.
Wordstream CPC data
WordStream publishes an annual industry benchmark report on Google Ads CPCs, drawing insights from over 17,000 campaigns.
Below, I’ve compiled their reported CPC data for U.S.-based advertisers from 2021 to 2024.
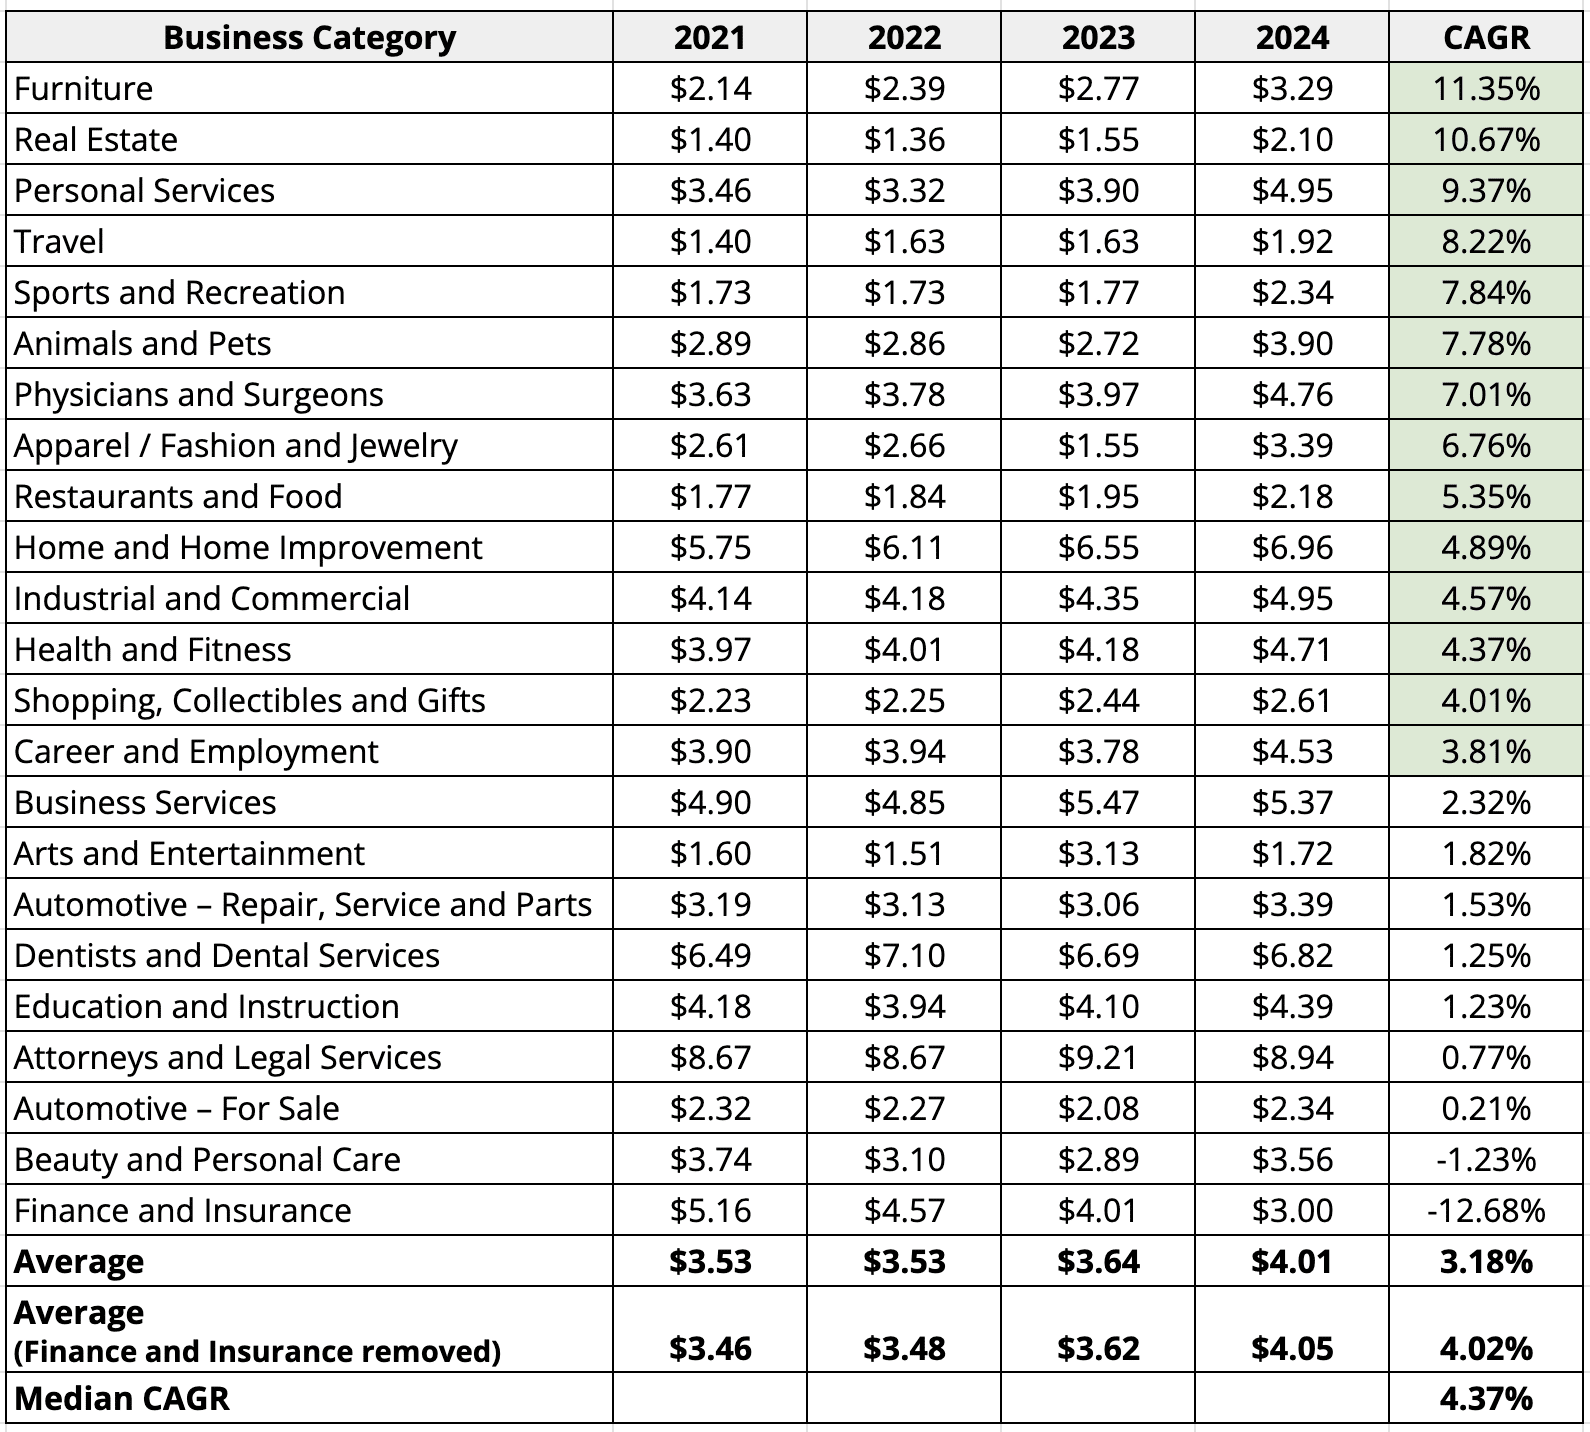
The first five columns show the average CPC for each industry by year.
The final column reflects the compound annual growth rate (CAGR), which is calculated to measure how quickly CPCs are rising on a smoothed annual basis.
To put this in context, the average U.S. inflation rate over the past five years – measured by the consumer price index (CPI) – is 4.24%.
Industries with a CPC CAGR above this benchmark are highlighted to show which are seeing CPC inflation outpacing general economic inflation.
Interestingly, 12 of the 23 industries analyzed have CPCs growing faster than the CPI.
That means the majority of industries are experiencing CPC inflation above the national average price inflation.
When averaging across all industries, the overall CAGR is 3.18% – slightly below the CPI.
However, this average is heavily impacted by an outlier: the Finance and Insurance sector, which shows a sharp -12.68% decline.
This anomaly may be the result of reporting errors, data shifts, or other unknown variables.
If we exclude this outlier, the average CAGR rises to 4.02%, and the median across all industries sits at 4.37%.
Both are in line with or slightly above CPI, reinforcing the conclusion that CPCs for most industries are increasing at – or faster than – the rate of inflation.
Dig deeper: Top Google Ads recommendations you should always ignore, use, or evaluate
Owned CPC data
The following data comes from accounts our agency manages.
We’ve selected seven accounts across uncorrelated industries, each with search terms that have had consistently high spend over a period of five years or more.
We chose search terms rather than keywords to eliminate ambiguity and ensure consistency.
A search term is an exact word or phrase, unchanged over time.
All of these terms have been managed by the same agency (us), allowing us to track CPC changes with high accuracy.
Below, we’ve graphed the CPCs over time for each of the seven search terms.
Legal industry
- CAGR: 14.25%

Dental industry
- CAGR: 8.97%

Ecommerce camping goods
- CAGR: 4.68%

Removalist
- CAGR: 10.99%

Medical technology
- CAGR: 12.79%

Footwear
- CAGR: 13.82%

Travel
- CAGR: 16.72%

Below are the summarized results for all industries.
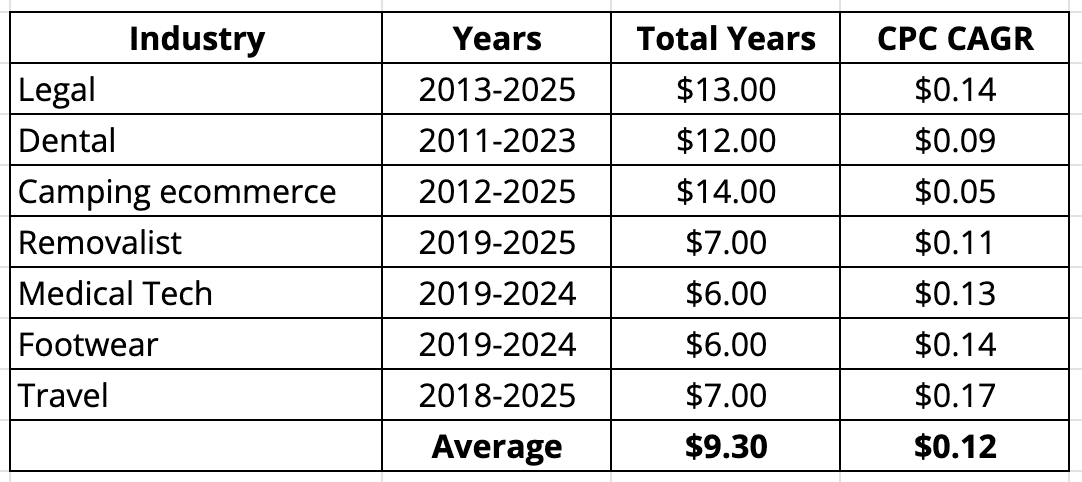
Across these accounts, the compound annual growth rate of CPCs is significantly higher than what we’ve seen in Google’s annual reports or WordStream’s benchmarks.
Summary of findings
We looked at three sources to understand how CPCs have changed over time. Here’s what we found:
- 2.33%: The average annual CPC increase from Google’s annual reports (2019–2024), covering all markets, platforms, and industries.
- >4%: The CAGR from WordStream benchmarks across all industries (after removing outliers) over the last four years.
- 11.75%: The average CAGR from our managed accounts, based on the top search term in each of our seven highest-spend accounts (average time frame: 9 years).
Based on years of experience, my gut feeling has always been that CPCs are rising rapidly – and our own data backs that up with an 11.75% increase.
But when we look more broadly, that growth moderates: WordStream shows 4%, and Google claims it’s just 2.33% – lower than CPI inflation.
So, which number should we trust?
The limitations of this approach
Using aggregated data – like WordStream’s benchmarks or Google’s reporting – comes with limitations. These sources may not be comparing apples to apples year to year.
For example, if an account switches to a new ad manager who slashes CPCs by shifting strategy, this might appear as a market trend – but it’s really a management change. Aggregated data can’t always control for that.
There’s also the issue of selection bias.
WordStream’s data may skew toward accounts that use their tools, introducing confounding variables.
Perhaps a tool update improved performance, or a price hike caused certain advertisers to leave. Their data might reflect advertiser behavior as much as market dynamics.
By contrast, our internal data is tightly controlled, so we understand the full context.
However, the tradeoff is sample size – seven accounts aren’t enough to reflect the entire market. So while our data may be more precise, it’s less generalizable.
Conclusion
All three data sources confirm that CPCs are rising. The question is – by how much?
And more importantly, what’s happening in your own account?
That’s the number that matters most.
If your CPCs are rising faster than inflation or benchmarks, you’ll need to respond – whether by:
- Raising your own prices.
- Exploring more cost-effective ad strategies,.
- Even shifting platforms.
Benchmarking your CPC growth against CPI or industry data can help you understand whether your account’s trajectory is justifiable – or unsustainable.
One final thought: If your CPCs are rising faster than inflation, then it’s cheaper to acquire a customer today than it will be tomorrow – and likely cheaper than it will ever be.
Major brands like Coca-Cola understood this long ago.
The brand equity they built decades ago still pays dividends today – and it was far cheaper to build back then.
Advertising is an investment. If CPCs go up, the cost of not investing today will only grow.
Dig deeper: PPC budgeting in 2025 – When to adjust, scale, and optimize with data


Recent Comments