

5 ways to drive action with your PPC report

Are you spending hours on client reporting every month, only for your stakeholders to skim it, dismiss the numbers, or ignore your recommendations?
When reports don’t drive action, you lose more than time. Budget approvals, strategic influence, and client trust are all compromised.
Here are five ways to make sure your PPC report doesn’t just get read, but actually moves your audience to take action.
1. Start with your audience, not the data
When building a report, it’s easy to get lost in the data – dozens of metrics, multiple platforms, endless ways to slice performance.
The instinct is to ask, “What data can I show?”
But that approach creates reports that highlight numbers instead of driving decisions.
A better question is, “Who needs this, and what will they do with it?”
What does your reader need to understand or act on?
To borrow from the Jobs-to-Be-Done framework – what is this report being “hired” to do?
- What decisions are your stakeholders responsible for making?
- What questions do they expect answered?
- Which goals and KPIs do they need to monitor?

Once you understand the job your report is meant to do, you can reverse-engineer what belongs in it.
For example:
- A CMO focused on connecting ad spend to revenue and competitive position will want to see ROAS, market share, and year-over-year growth.
- An ecommerce manager focused on product mix will care more about category performance, inventory, and seasonal trends.
Off-the-shelf templates and automated reports can’t answer those questions for you – only direct conversations with stakeholders can.
You don’t need to wait for a new client kickoff to do this.
Check in with your current stakeholders to confirm your reports still reflect what matters most to them.
2. Establish the source of truth
If you manage platforms like Google Ads and Microsoft Ads, you’re likely reporting on engine numbers.
But engine numbers aren’t always the “source of truth.”
Sometimes they’re only directionally accurate. Other times, they barely correlate with actual performance.
Here’s the risk when you don’t define that source upfront: you build and present a solid report, only to have it derailed by, “I don’t think these numbers are right.”
A client questions whether Google Ads is inflating conversions, or a CFO insists revenue must come from the CRM.
Suddenly, the discussion shifts from strategy to data defense.
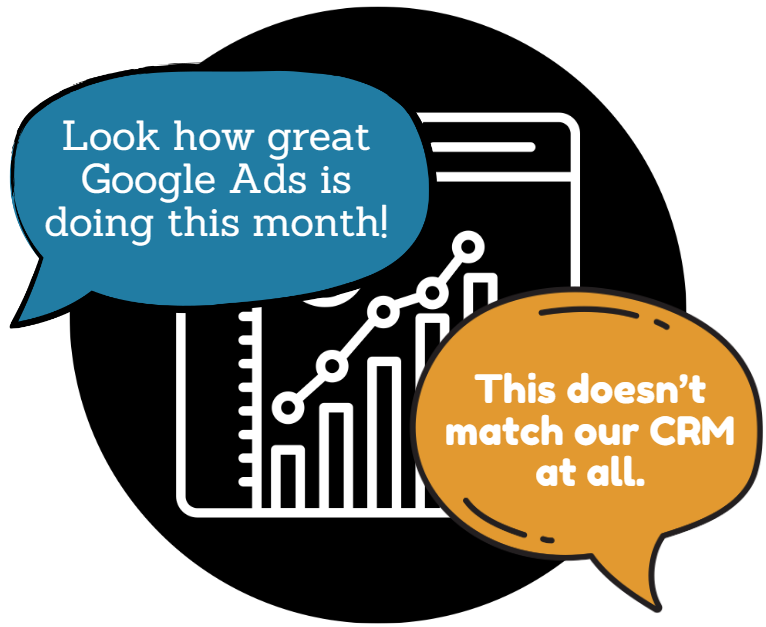
When stakeholders don’t trust the numbers, your report loses its power. You can’t drive action on data that no one believes.
So before building a report, clarify the source of truth.
A quick litmus test: if you said, “We generated $1 million in PPC revenue yesterday,” what system would leadership check to verify it?
Whatever they name is your source of truth.
You may never reconcile every dataset perfectly, but alignment matters most.
Pull numbers from that trusted system where possible, call out known gaps – like offline conversions lagging in Google Ads or modeled data in GA4 – and always identify data sources clearly.
When your reporting reflects the system leadership trusts, you avoid endless debates about accuracy and keep the focus on decisions that move the business forward.
Dig deeper: How to deliver monthly PPC reports clients love
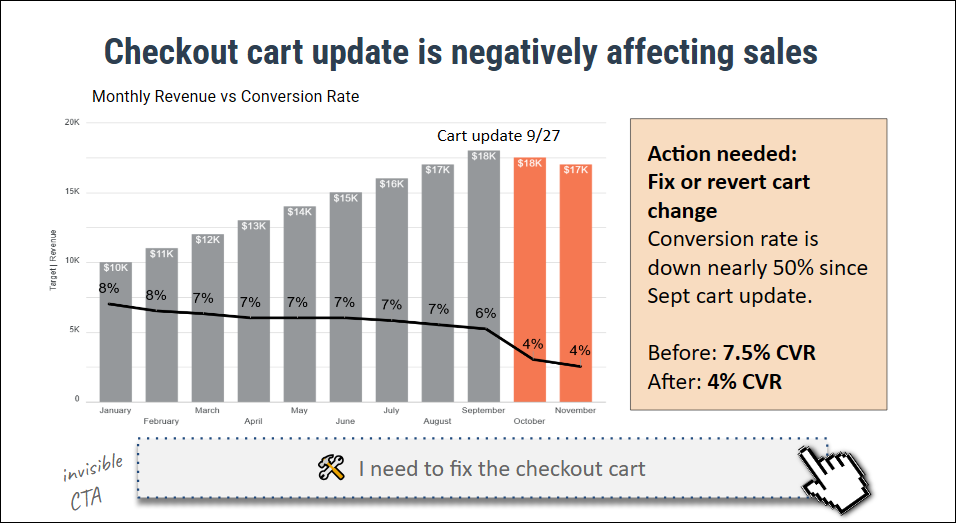
3. Build invisible CTAs into every section
A strong landing page drives action with a clear call to action.
Without one, visitors don’t know what to do next – and conversions drop.
Reports work the same way, only without a button to click.
That’s why I developed a framework I call “invisible CTAs.”
An invisible CTA is the intended outcome for each section of your report – the “conversion” you want your audience to experience.
It doesn’t appear in the report itself, but it guides how you build every chart, annotation, and insight.
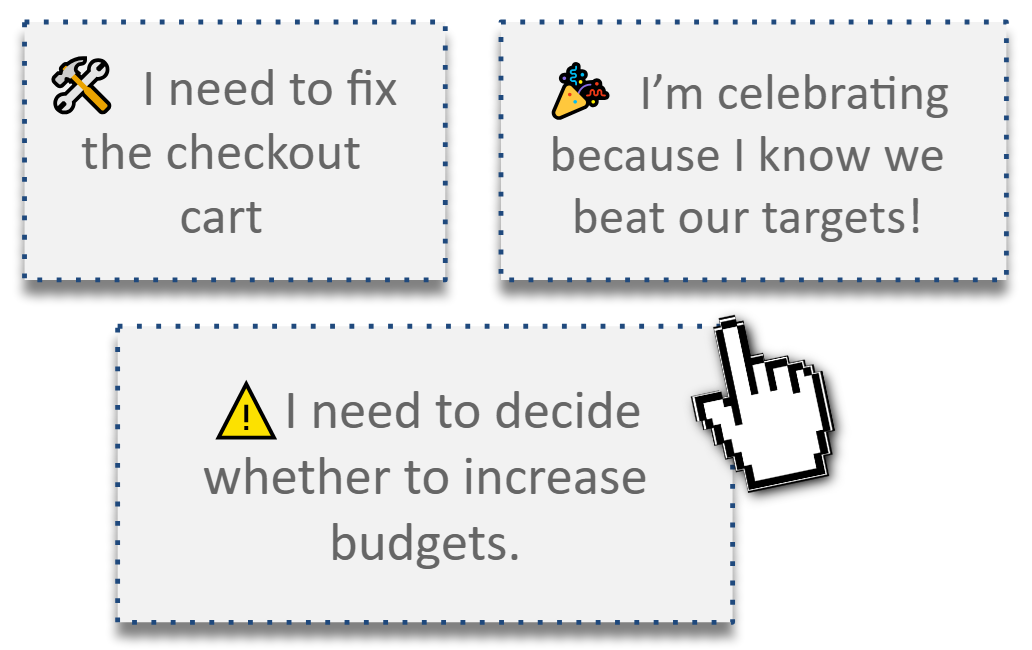
There are three types of invisible CTAs:
- Do: The next step they should take based on the data – fix a landing page, approve budget reallocation, or adjust strategy to defend against a competitor.
- Know: What happened and why, even when there’s no immediate action – a holiday promo drove a 15% spike that won’t sustain, Apple’s privacy updates reduced match rates, or a tracking glitch underreported conversions.
- Feel: The emotional response that drives urgency or confidence – concern that a competitor is outspending you, encouragement that a new strategy is working, or worry that rankings are slipping.
Don’t shy away from negative emotions.
When we hide problems to keep reports “positive,” stakeholders won’t commit the resources needed to fix them.
Think of it this way: which battery icon motivates you to get off the couch and grab your charger?
Not the full one.
Before building any section, ask:
- What’s the one takeaway I want my audience to leave with?
Then design everything – your charts, metrics, headlines, and comparisons – around that invisible CTA.
When each section has a clear intent, your audience knows exactly what to do next, even without clicking a button.
Get the newsletter search marketers rely on.
See terms.
4. Apply conversion principles to design and layout
Most PPC reports are still designed like data dumps, not decision tools.
Charts are crammed together, walls of numbers lack focus, and abbreviations or shorthand leave readers guessing.
Your audience shouldn’t have to work to understand what the data means.
As Steve Krug explains in “Don’t Make Me Think,” good design removes friction and makes meaning obvious.
The same principle applies to reporting.
Your reports should follow the same conversion optimization principles you’d use on a landing page:
- Hierarchy: Prioritize the key story. Bold the outcome. Move secondary data to callouts or appendices.
- White space: Clutter kills comprehension. Give major insights room to breathe in their own sections or pages.
- Contrast: Use color, weight, and position to highlight wins and risks.
- Annotations: Mark charts with context (seasonality, tracking glitches, site changes).
Look at how these conversion principles transform the very basic “Account Performance” chart into completely different data stories:
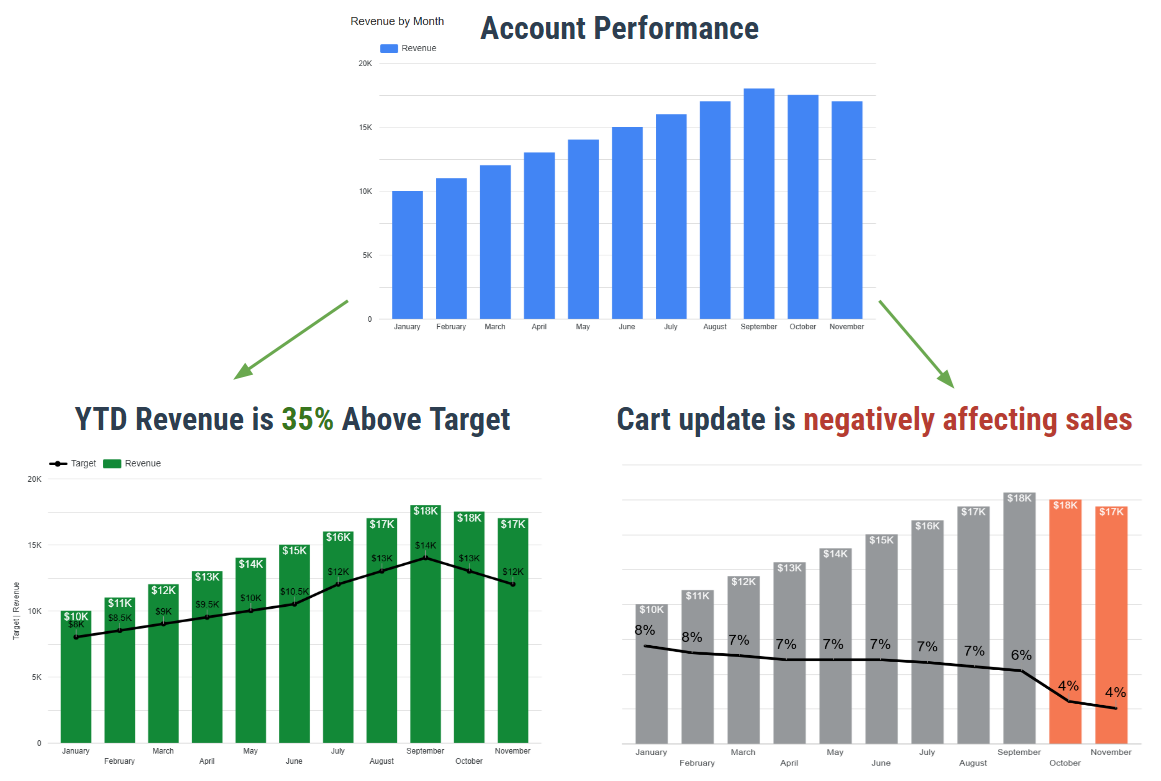
Every design choice should reduce friction, clarify meaning, and guide your audience toward the right conclusion.
5. Show results in context, not isolation
We often hope the numbers will speak for themselves – but they don’t.
“We drove $17,000 in revenue” means little unless your audience knows whether that’s above goal, below forecast, or right on target.
Without context, stakeholders don’t know how to react.
They can’t celebrate a win if they don’t know it’s a win, and they won’t prioritize fixes if they don’t see the urgency.
Every metric in your PPC report needs a frame:
- Benchmarks: Was performance above or below target?
- Comparisons: How does it trend versus last month, last year, or competitors?
- Explanations: What caused the change – seasonality, tracking issues, or market shifts?
For example, “$17,000 in revenue” becomes meaningful when you add context:
- $17,000 is 35% above the goal of $12,600.
- $17,000 is 11% higher than last October’s $15,300.
- $17,000 represents nearly 25% of all-channel revenue ($70,000).
The more comparisons, percentages, and explanations you layer in, the easier it is for your audience to understand what’s really happening.
Combine that context with conversion principles and invisible CTAs to create reporting that’s clear, credible, and built for action.
Dig deeper: How to benchmark PPC competitors: The definitive guide
From data dump to decision driver
The purpose of PPC reporting is simple – to help your audience understand what happened and what to do next.
If your reports don’t accomplish that, you’re not just wasting time. You’re leaving your readers without the clarity they need to act.
When you design reports around your audience’s needs, anchor them to a trusted source of truth, build invisible CTAs, apply conversion principles, and show results in context, you turn reporting into a decision-making tool.
Follow these steps, and your PPC report will stop being a monthly time-sink and start becoming a high-value asset that earns trust, drives action, and strengthens retention.


Recent Comments